Service Design Analytics
A framework for assessing and improving the performance of government services that involve direct transactions with the public.
Performance measurement in government is a broad discipline. Service Design Analytics aims to create a framework focused specifically on assessing and improving the performance of government services that involve direct transactions with the public. This framework combines human-centered design, business process modeling, and automated data analysis. Learn more in the original GSA Service Design Analytics project .
What is Service Design?
"Service design is the activity of planning and organizing people, infrastructure, communication and material components of a service in order to improve its quality and the interaction between service provider and customers."
— Designing for Service (Bloomsbury, 2017)
Service design thinking means taking a holistic approach to the way a service is orchestrated. By understanding key touchpoints across multiple modes of interaction, one can find ways to reduce friction and streamline the whole process.
Journey Maps and Service Blueprints
Journey maps take a human-centered approach to document user experience across the full path or lifecycle of a service. They illuminate blind spots where the service provider is unaware of obstacles or inconveniences, instilling more empathy for user experience.
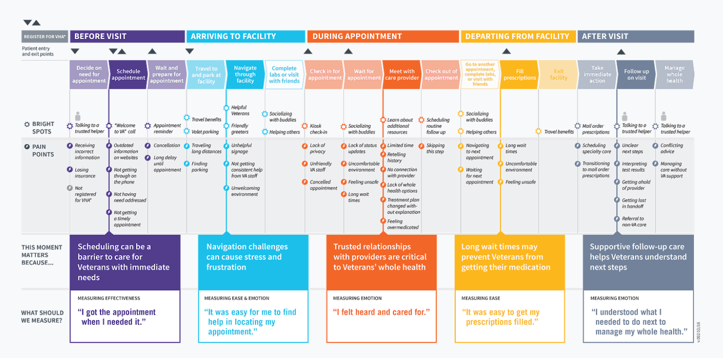
The VA Patient Experience Journey Map represents common moments Veterans experience before, during, and after an outpatient appointment.
Business Process Modeling and Unified Service Blueprints
The other side of the equation is understanding how service transactions are processed behind the scenes and how these business operations relate to user interactions in the journey map. Business process modeling uses standards like Business Process Model & Notation (BPMN) to understand the interlocking mechanics and decision flows within an enterprise.
By integrating user-centric journey maps with backend business process models as a comprehensive service blueprint, we create a global view of operations to harmonize internal communication, contextualize user research, instrument and display performance analytics, and set priorities for improvement across all stakeholders.
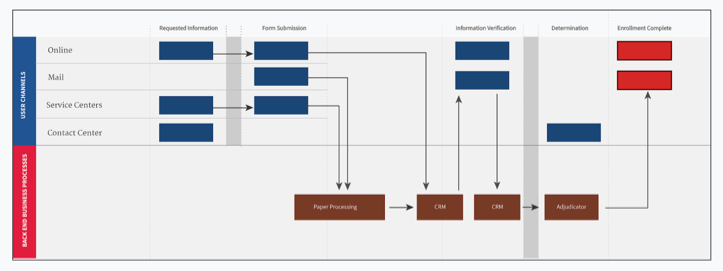
Service blueprint integrating user journeys with business processes and multiple service channels.
Data Without Context is Driving Blind
The speedometer on a car's dashboard isn't helpful if you can't see the speed limit sign through the windshield. This is also true when producing business intelligence to improve service delivery without a service blueprint.
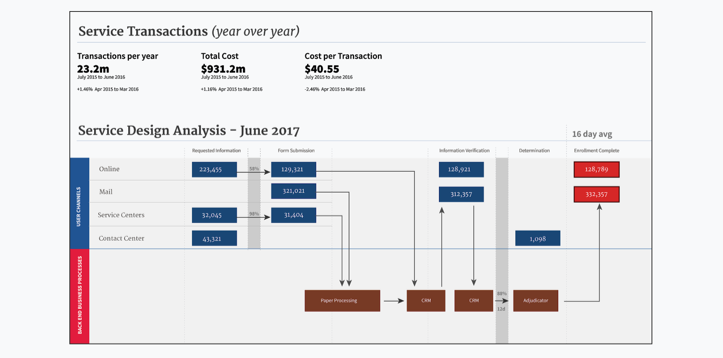
By instrumenting embedded measurement touchpoints throughout the service blueprint, we can see not only top level metrics, but also the inner-workings of the service to identify areas that would most benefit from attention.
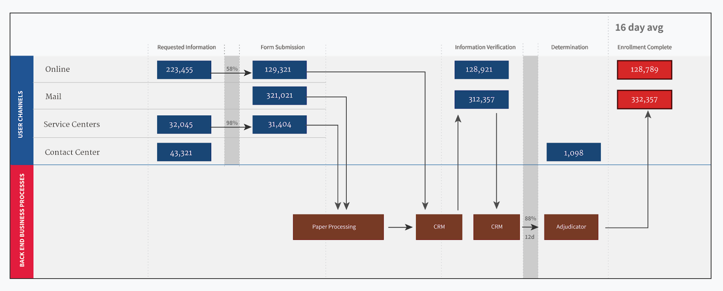
Service blueprint with measurement touchpoints and analytics overlaid.
Comprehensive service blueprint showing frontstage (user-facing) and backstage (internal) processes with multiple channels and analytics integration.
Universal Indicators and Failure Demand
While universal indicators like Net Promoter Score are commonplace in the private sector, they don't always make sense in the public sector where there's often a single service provider. Instead, measuring "failure demand" — the demand generated based on the failure of a transaction to meet user expectations — can be more valuable. Common ways to measure this include tracking help requests or contact center calls associated with specific steps in a transaction.
The key to understanding universal indicators is knowing that they can identify if there is an opportunity for improvement, but rarely diagnose how or why. By instrumenting measurement throughout the service blueprint, we equip program-level staff with sensors and alarms to notify them of problems before they become unmanageable.
Service Design Analytics as a Service
Generic performance metrics alone will not guarantee performance improvement. By instilling design thinking and analysis in a government-wide service offering, we can provide shared tools for iterating on service blueprints and pulling disparate metrics together. This transforms our understanding of services into one that encompasses multiple business units, considers the user's perspective at its core, and provides data for program-level staff to identify where and how to improve user experience and operational efficiency.